The solution for energy demand modelling in buildings applies to the optimization of building designs towards higher energy flexibility.
The solution Energy demand modeling in buildings covers a range of complex methodologies for the modelling of energy demand and flexibility potentials for whole districts and cities. With data from the main energy carriers which are heat, cooling, electricity and gas, buildings in a given area are classified and the sum is accumulated up to the aggregate level.
 Impact
Modelling of greater energy flexibility in buildings is crucial to a city which in the future will be powered by 100% renewables.
 Solution insights
The solution apply to a combination of measurements and a model that is validated by actual measurements. In this way the accuracy of the solution is improved with increasing number of data and improves by experience.
The methodology itself apply to two main aspects. Firstly, to analyze measured data from buildings and secondly, to classify them into types.
The resulting building types are modeled in dynamic building simulation tools and by aggregating the actual number of buildings in a given area the result can be compared with the overall energy demand for a given city or district.
In a second step, the thermal dynamics are examined to find flexibility. Here thermal capacities of the buildings in a given area, thermal storage tanks and similar storage capacity is used to adjust to the aggregated flexibility demand.
A schematic representation of the model of Sønderborg municipality’s energy system
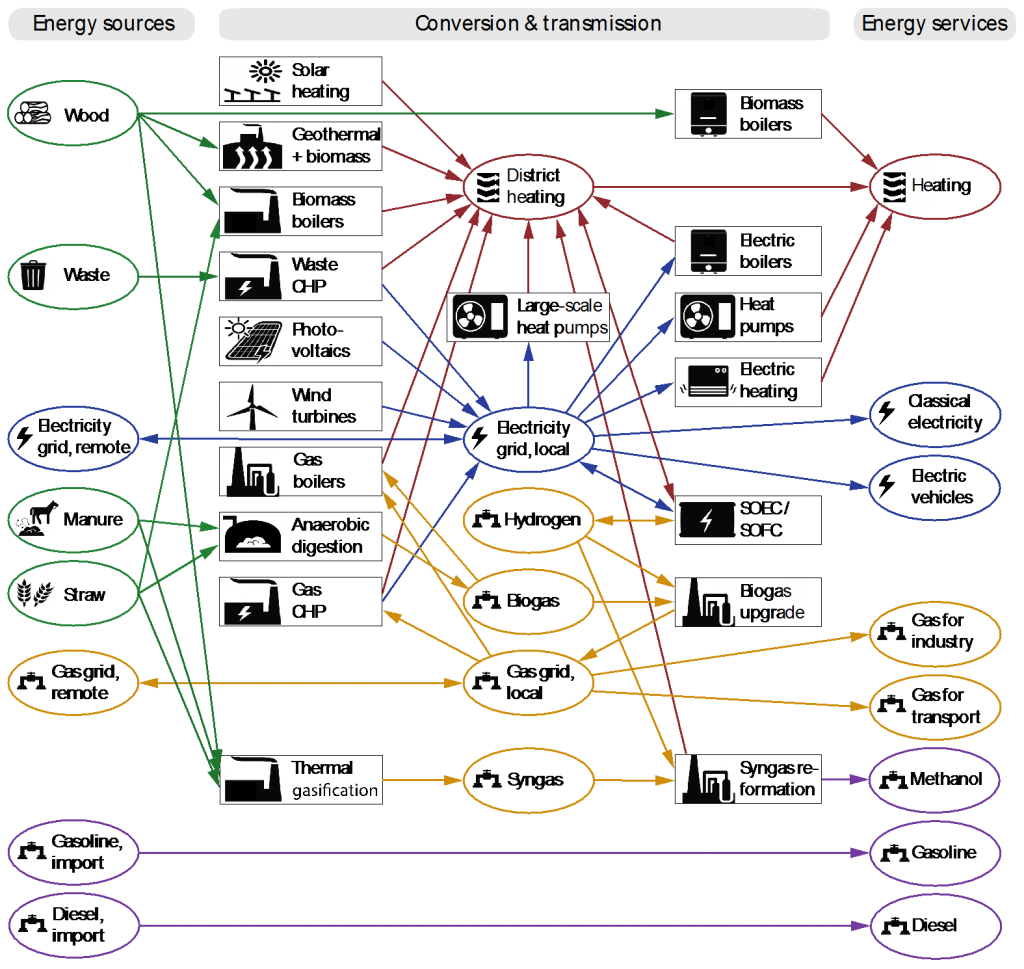
A schematic representation of the model of Sønderborg municipality’s energy system showing the components and energy flows of the model for the 2029 scenarios. Energy sources and imports to the municipality’s energy system are shown on the left of the flow chart and energy services (demand) in the municipality are shown on the right. Rectangular fields denote energy conversion units and elliptical fields denote energy carriers and distribution networks. Biomass is indicated in green, electricity in blue, natural gas in orange and petroleum products in violet. For simplification, the schematic excludes energy storage facilities. Drawing by D. Sveinbjörnsson.
 Further information
The project of CITIES Research Center is expected to continue on improving the solution until June 2017.
The solution “Energy demand modelling in buildings” was developed in main collaboration with Project Zero. Project Zero is a visionary initiative from the municipality Sønderborg in Southern Denmark. The organization is 100% committed to
creating a CO2-neutral growth area before 2029, creating and demonstrating new solutions, robust measurable CO2 reductions, new green jobs and a talented generation of young people.
In order to achieve its mission, Project Zero has been measuring the CO2 for Sønderborg for several years. This task turned out to be very demanding and their previous method provide limited accuracy. Now, with the solution of modeling energy demand in buildings in combinations with CITIES Data Management System the estimations of CO2 had become much more accurate and automated based on measurements.